📊 Composite Headcount Dashboard Overview
A composite headcount dashboard works almost identically to the standard DCM dashboard, in that it displays one hour of data in real time – but instead of the numbers being for one camera- it combines multiple cameras.
They are also not restricted to total headcount, but can also be set up to show average density, crowd flow speed, or average mood in your venue (or a part of it).
💡 Use Cases
This can be a particularly powerful option for live capacity counting. For example, if you are managing a venue, that has a large event space covered by several cameras, data can be combined into a single simple view that shows “Total Headcount” in the main area in real time. You can then add an alarm to instantly notify key staff if a set capacity of the area is breached. If cameras are available in queue areas at entrances – a similar page can be set up to track total queue numbers.
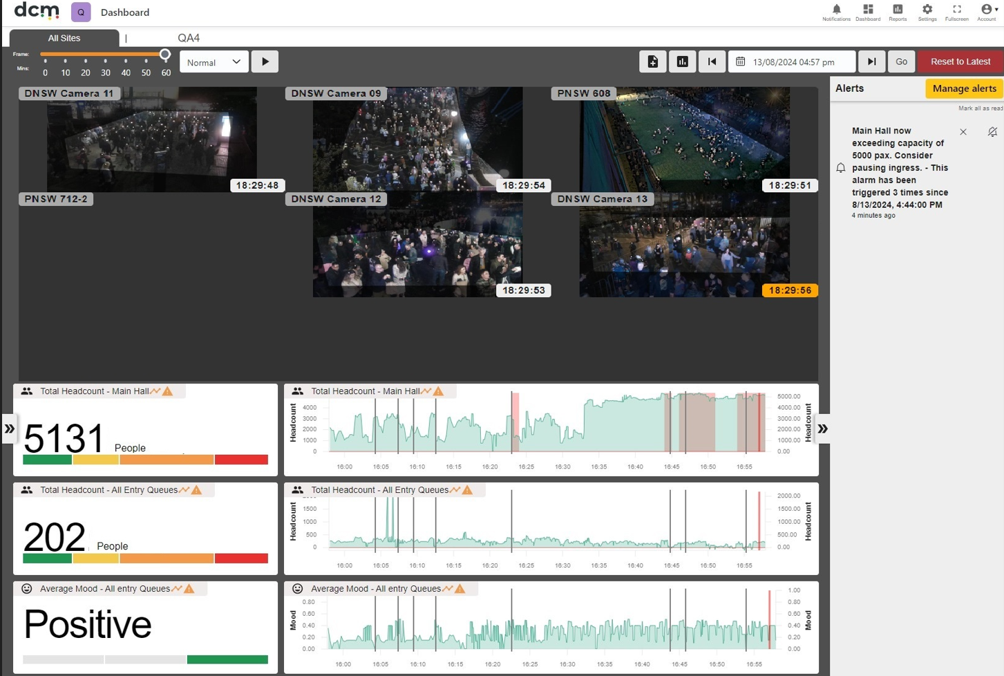
An example of a composite dashboard is below, combining data from multiple cameras to give a single simple dashboard showing headcount in a main entertainment area, and the total headcount of queues into the venue.
⚙️ Setting up a Composite Dashboard
Enabling a dashboard option other than the default, currently needs to be done at the back end by the DCM team. The DCM team can work with individual customers to set up a combination of data that is meaningful for them.
Custom formulas can even be applied to compensate for parts of a busy area not covered by camera views to estimate the missing headcount and give a total current attendance, based on expected crowd distribution. Alternatively additional cameras could be installed to cover the blind spots to make the most accurate count.
Once the basic formulas and graph labels have been agreed between DCM and the customer, and the custom composite dashboard enabled, the customer can use the same processes as the default dashboard in most cases to configure it from there. This includes full support for Alarms, the users can configure themselves.
Composite data graphs can also be mixed with standard single camera data streams for headcount, density flow and mood.
Note that for graphs of composite data – the rolling average and rolling max functions have no effect, as the data is controlled by the agreed formula instead.
This simplified custom dashboard option does not use the heatmaps and some other features of the default dashboard, and is intended to deliver just the data most important to you, and give an ‘at a glance’ view of crowd trends to inform decision making.