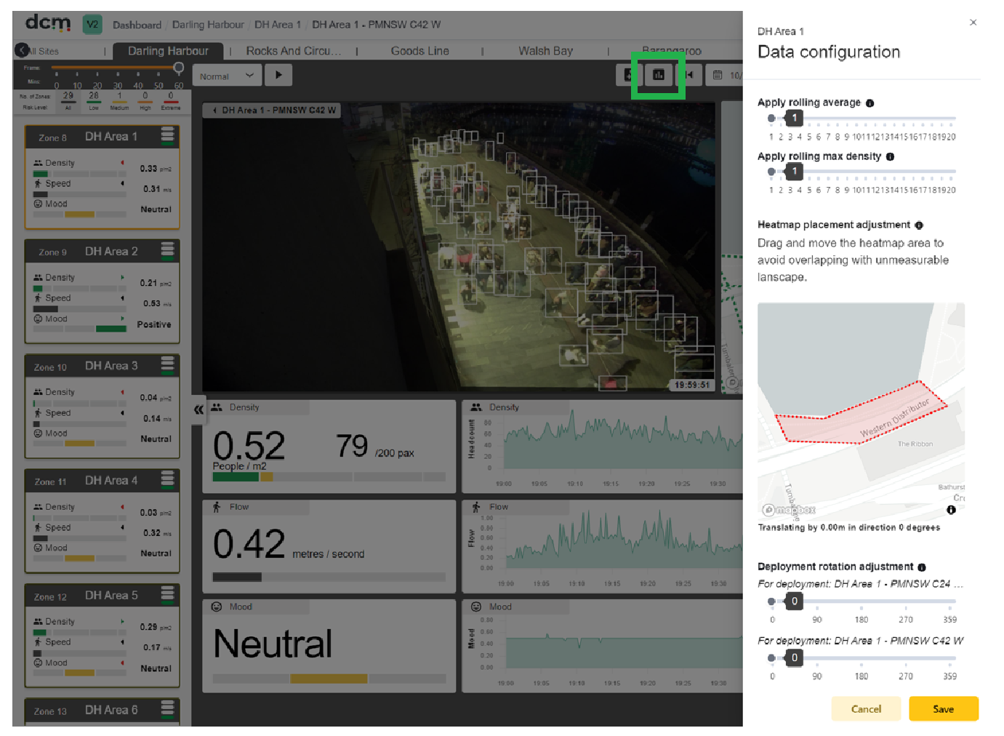
Dashboard display options can be adjusted on a per zone basis. The configuration menu is accessible from the top menu, with a zone card selected as shown below.
Use the configuration menu to adjust the data displayed on the map, the graph parameters, definition of risk levels and other display options.
Shifting or rotating the heatmap can be useful if it does not exactly line up with your site overlay for example, but you don’t want to do a full re-calibration. Graph smoothing can be useful to filter out short term changes and make longer term trends clearer.
Clicking the ‘configuration’ icon inside each zone dashboard, located above the video footage, will set thresholds for that zone only.
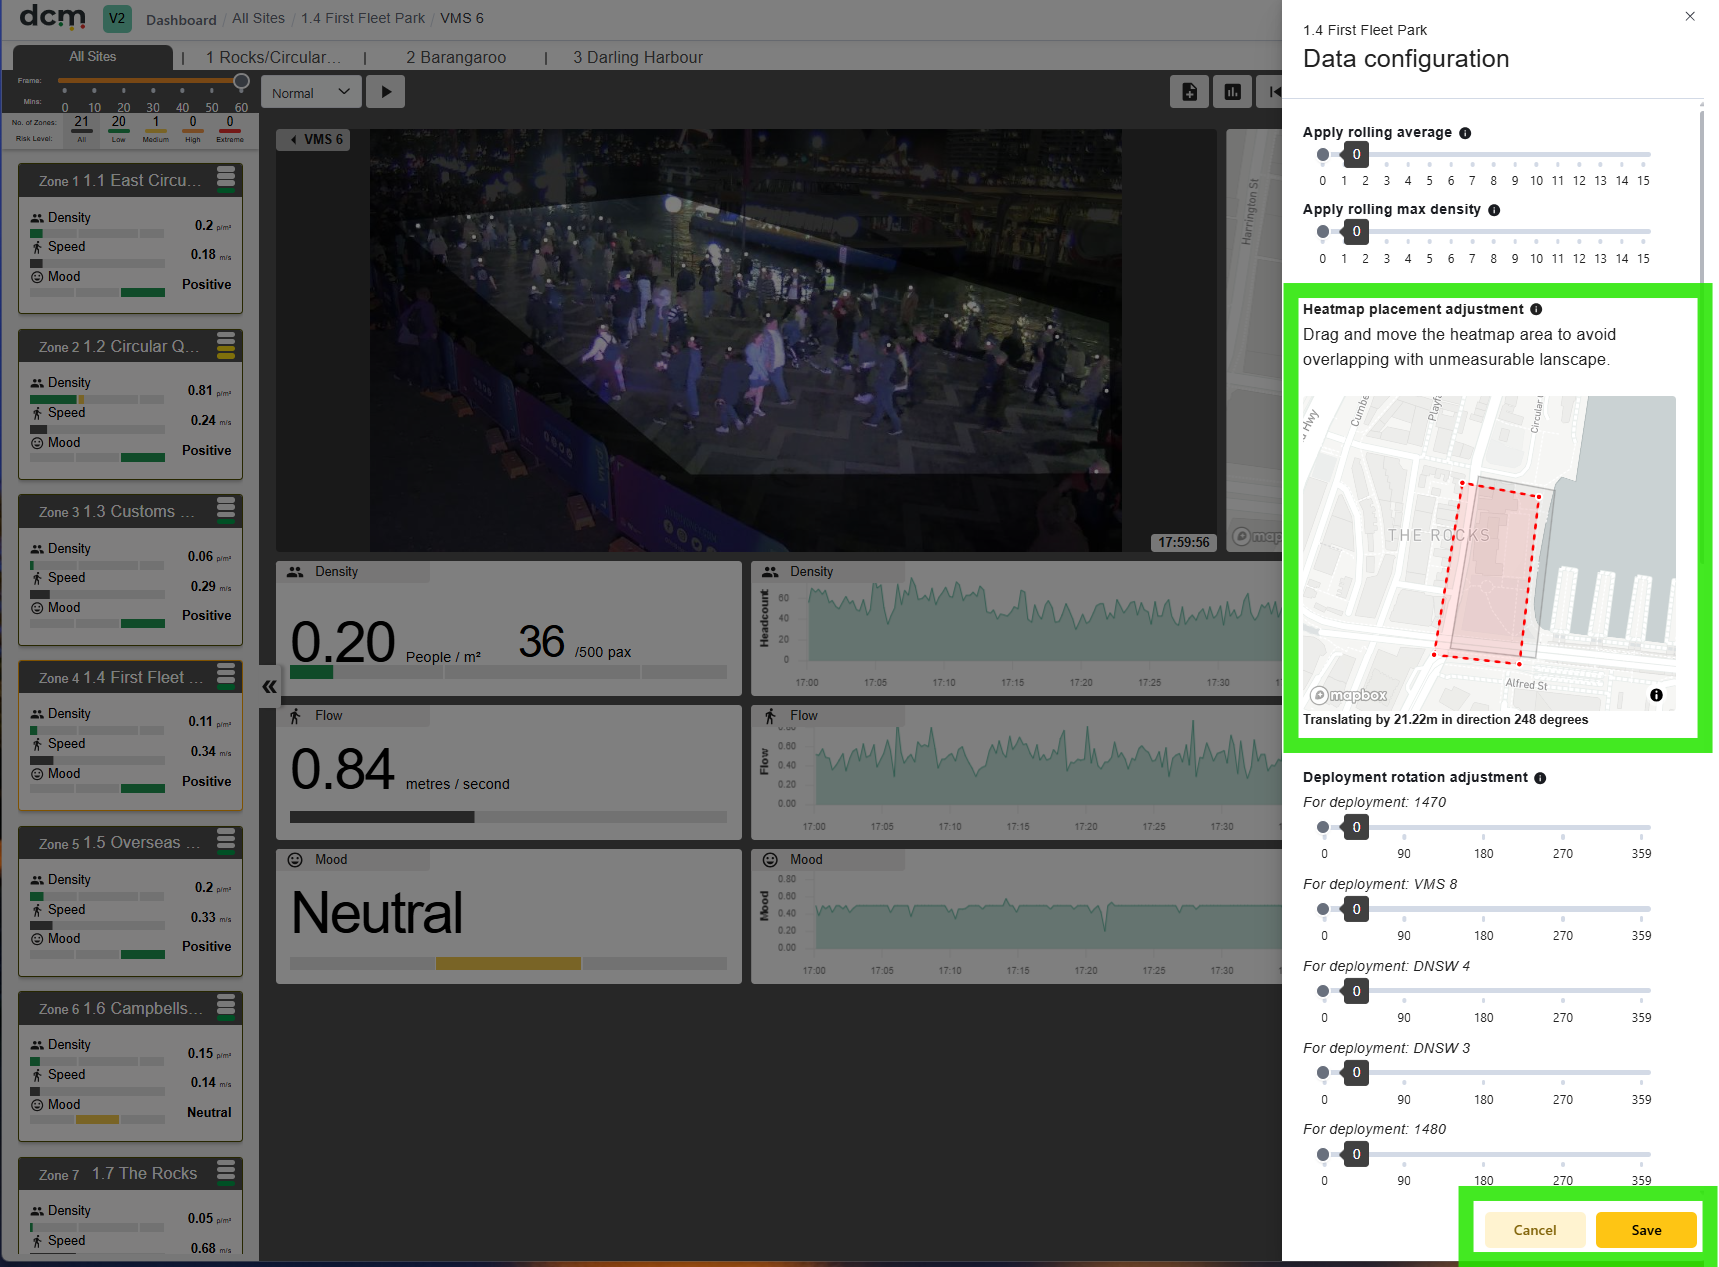
Press ‘Save’ when the adjustment is finished. Press ‘Cancel’ to undo all the changes.
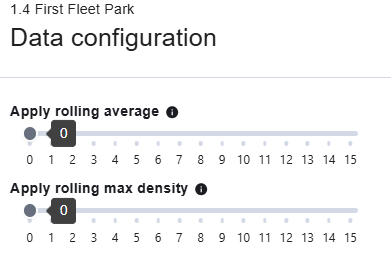
Apply Rolling Averages to graphs:
Here you can apply a rolling average setting for all graphs (Density, Flow and Mood) or a rolling Max setting for Density only. This can be useful when temporary factors obstruct the camera view (like raised hands, smoke or lighting effects) or to more clearly see long term trends. The average or maximum reading for the last X minutes is displayed, where X is between 0 and 15 minutes. Rolling max overrides rolling average for density.
Note that enabling this setting, means the data displayed is delayed – so may not match with the most recent displayed sample image.
Heat map placement adjustment:
The user can make quick adjustments to the location of the Heat map by clicking and moving the area on the map. This can be used to correct camera placement errors, but can affect mapping accuracy.
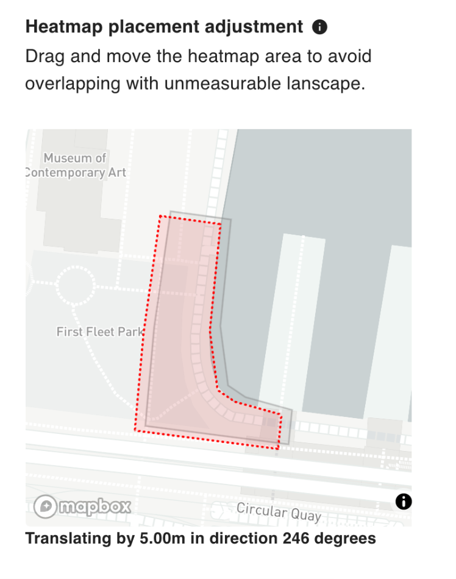
In general it is best to make only smaller adjustments using this tool. Larger errors are best corrected by editing the base calibration.
Such shifts also affect all cameras in the zone. So if there is more than one camera per zone, this option is not recommended, and again, each calibration should be adjusted instead.
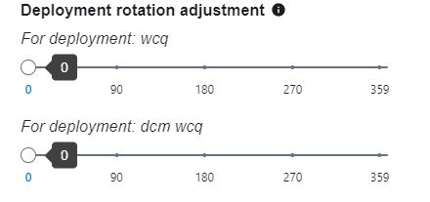
Deployment Rotation Adjustment
-
User can make additional corrections to the heat map projections to better fit the map in the event the map does not reflect one to one with the calibration. Corrections are made in degrees with 0 being north.
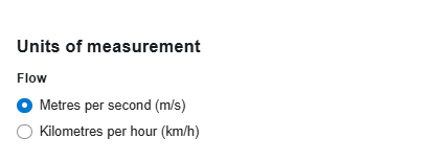
Units of Measurement
Here you can choose between smaller or larger units of measurement.
Note that DCM supports international units, but this option is controlled at the Project configuration level not at the zone level.
Area Capacity
Here you can enter a headcount capacity for the zone. This limit is displayed on the dashboard along with an indicator if the currently detected headcount exceeds the set limit.
This setting is separate to alarms, that can also be set using headcount criteria. By default this setting relates to data from a single view – but becomes particularly powerful for real time Crowd Counting when used in combination with the Composite Dashboard option that will be discussed in the next section.
Aside from these display options, this panel also sets the Risk level thresh-holds.
These drive the Traffic Light and Zone colour updates seen on the dashboard.
How to set these is covered in the next page: