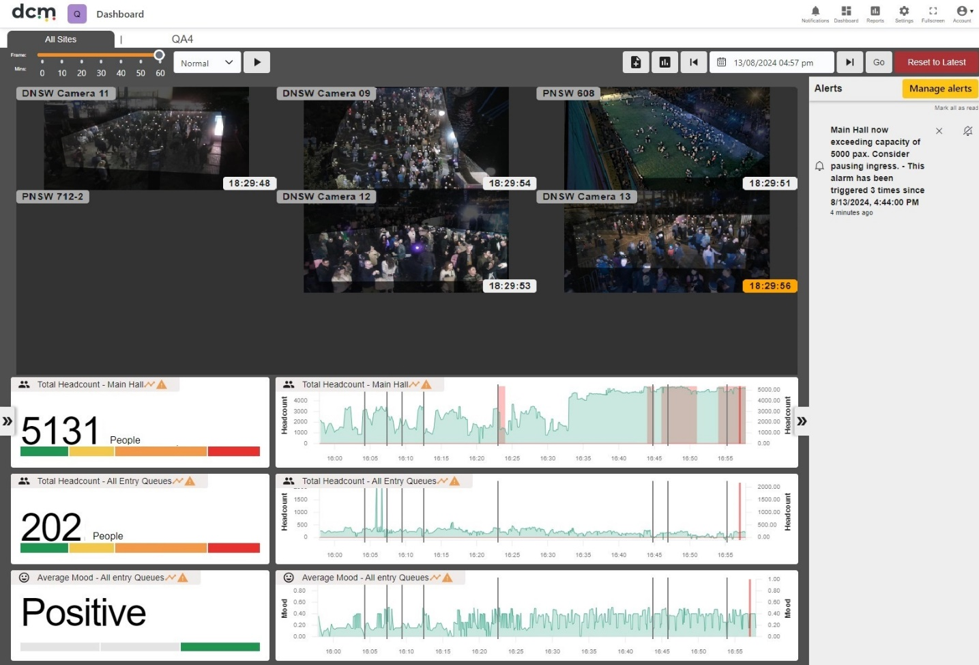

As well as flexibility on the source of camera image streams, DCM has multiple options for display of that data. The default dashboard displays data in zones, which are defined on a map of the customers building or site. There can be one or many cameras per zone – but by default the Density, Flow, Mood and Headcount data displayed in the graph is from a single camera.
DCM can optionally however, be set up to combine data from multiple cameras into a single graph as a total or average.
This option is most often used as a crowd counting solution, and is explained in more detail in the section titled “Using DCM for People Counting”.
An example of a composite zone Dashboard.