DCM includes a reporting engine that can deliver customisable detailed reporting in either graphical or table form. Reports can be accessed by clicking on the “Reports” Icon at the top right of the Dashboard (highlighted in red below).
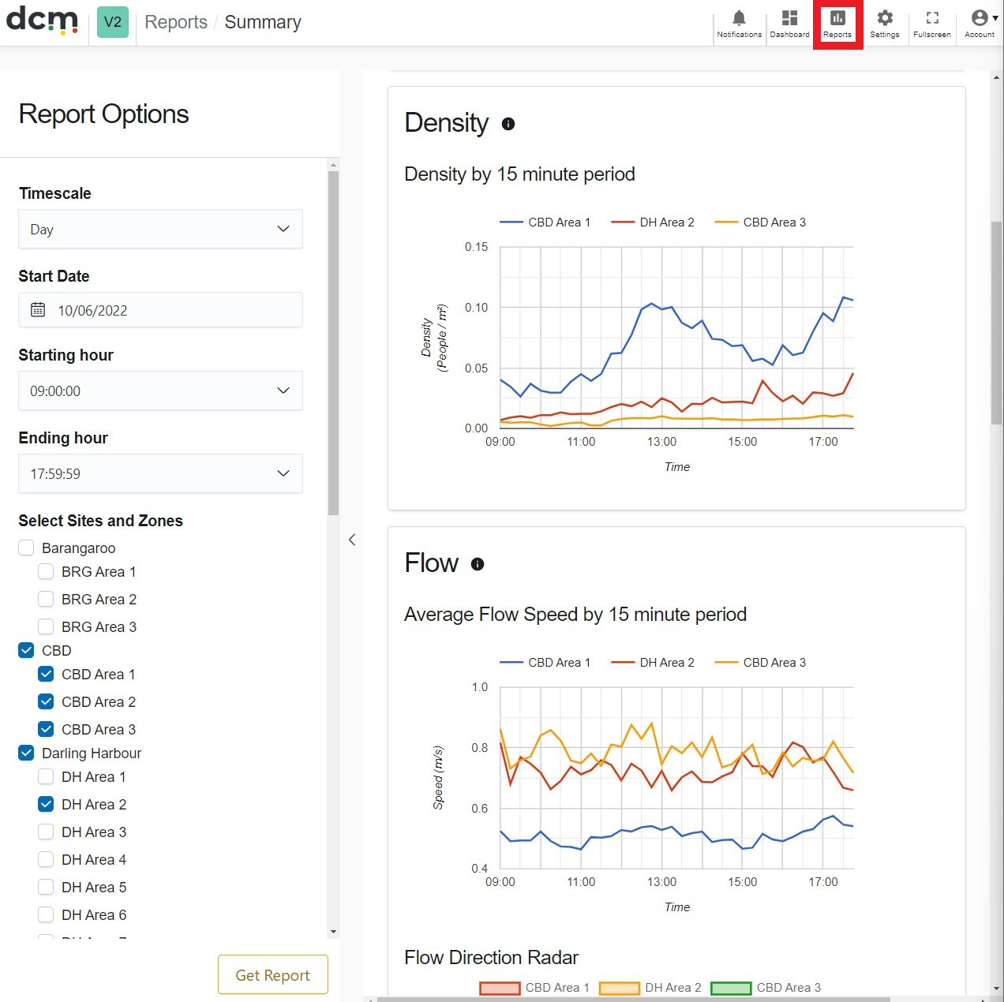
Any time duration from a few hours to a day, week or up to a month can be selected. The user can also select from any type of metric that has data available for the given project. The data can be displayed as graphs or tables.
There is also an option to list all Audit events, and all Alarms, including who has acknowledged or dismissed them and when.
Additional Custom reports
The reports engine is flexible and it is possible to add custom reports tailored to your environment or situation. This may involve a discussion with the DCM team to determine your requirements and enable us to configure the report.
For example, a common request is to create a ‘Capacity Report’ that shows the total attendance at your entire venue or a part of it on demand.
Even if you do not have complete camera coverage of the entire area, this may still be an option, as we can use plans or maps to deduce the available area compared to the available view are and multiply results accordingly to produce an estimated attendance report, that will still likely ben more accurate than manual counting by staff or most alternative crowd counting methods.