

📊 Use of Capacity Reports for Crowd Counting
If your project has more than one standard camera you can create your own capacity reports to present data on total attendance.
Only project administrators can create reports, but any user can run them once created.
⚙️ Setting up a Capacity Report
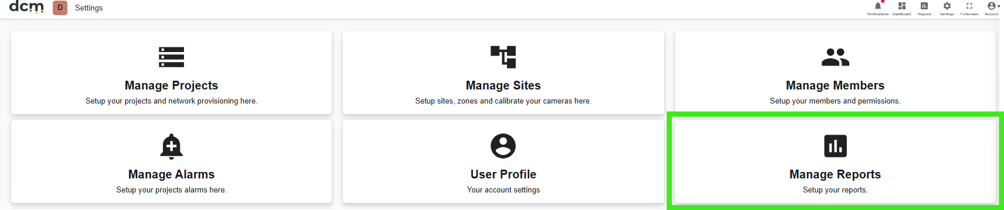
A project administrator can configure their own capacity report from the Settings page, and selecting the “Manage Reports” option.
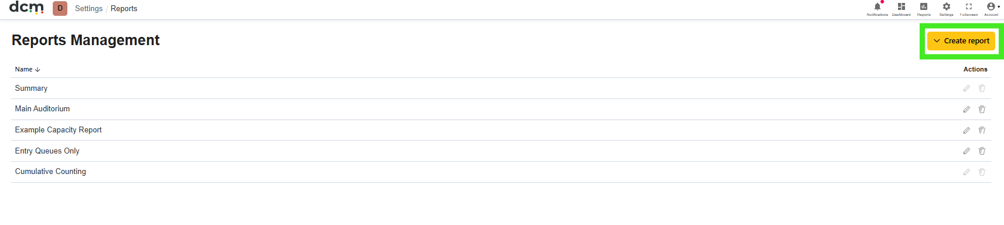
This will take you to the Reports Management screen, where you will see a list of existing default and user created reports. User created reports can be edited or deleted from this screen using the icons on the right.
To create a new report, click on the yellow “Create Report” button.
In the main report editing screen, you can customise the data. This includes the option to present results as Average numbers for each data period, or Maximum numbers. For example, if you ran a report and chose a 15 minute data interval – the report would list either the average number of people from all readings within that 15 minutes, or the highest reading within that 15 minutes. The number of data points depends on the individual camera settings.
From this screen you can also define areas with your venue or event that are meaningful for you.
Each added area will appear as a column in the final report, and can contain one or more cameras depending on the physical setup of your space.
The report creation screen.
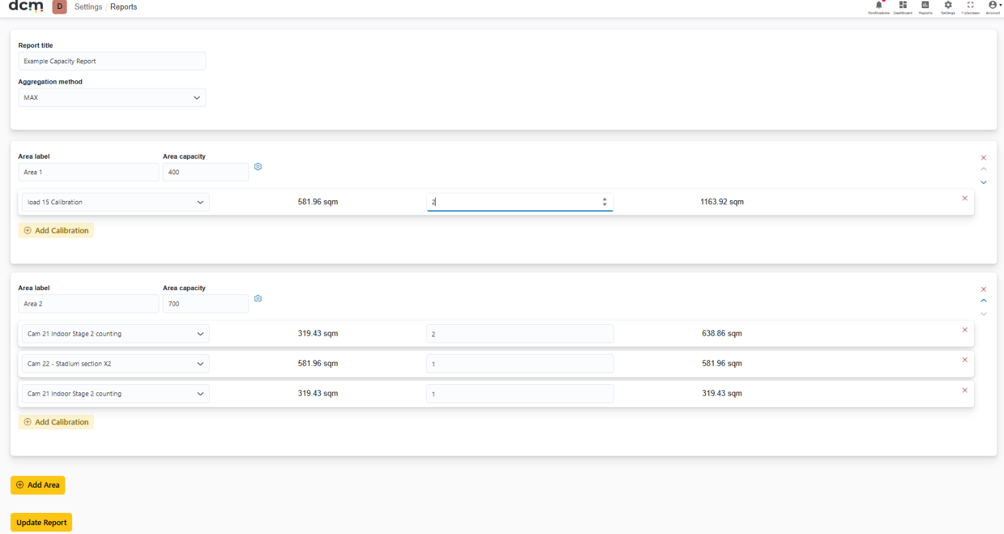
Cameras for each area can be selected from a drop down list by calibration name. It will also list the calculated area of interest in square meters for that camera, as detected during the calibration process.
Optionally, the user can choose to apply a multiplication factor. These options are intended for situations where your existing cameras in that area do not have 100% coverage of the space. For example – if you know that your only camera in a particular area can only see 50% of that areas floorspace, and you expect the distribution of patrons to be roughly even in the space, you could set a multiplication factor of 2. This means that if the camera detects say 50 people on average in a time interval, it will report the average Capacity for that time interval as 100 people.
Depending on the camera setup, the user can also optionally set an overall capacity and force the software to set multipliers that divide the space up evenly between cameras.
Once you are happy with your settings, press the ‘update report’ button – which will save your settings and return you to the Reports Management list with your new report now listed.
▶️ Running the Capacity Report
Once created, any user of the project can run the report using the standard reports function, accessible from the main dashboard.
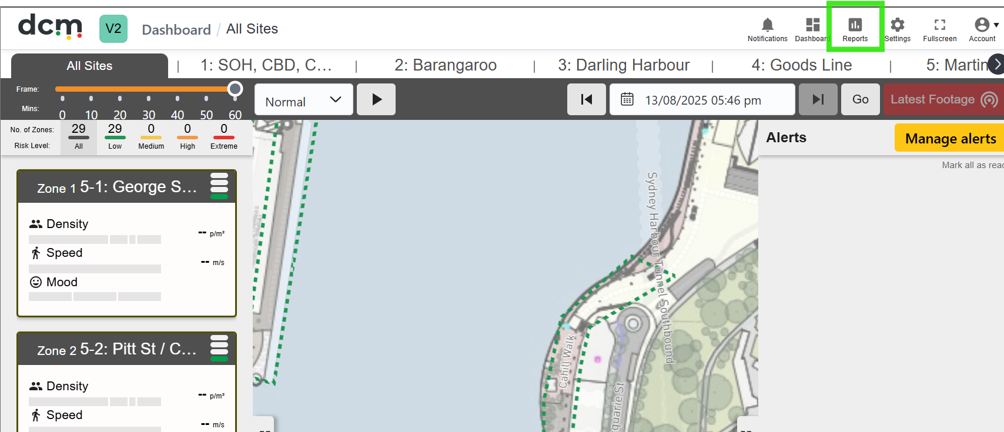
This will take you to a report list.

When running the report – the user selects the date and the Data interval. Options are 5, 15, 30 or 60 minutes. Each figure in the report represents data from the preceding time interval, starting from 12:00AM on the selected date. So for example, if the user selects a 15m interval, the first line will show data from 12:00AM to 12:15AM.
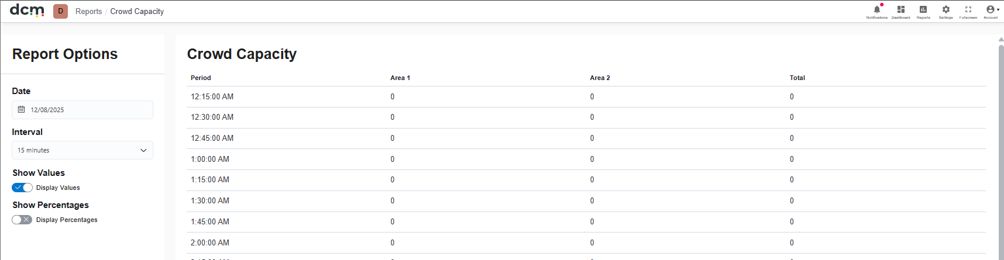
An option also exists to show not only the raw numbers but also the percentage of the configured capacity for that area. Note that entering a capacity for an area is not mandatory, and if no capacity is set the report will simply list the percentage capacity as “NA”
The final capacity report.
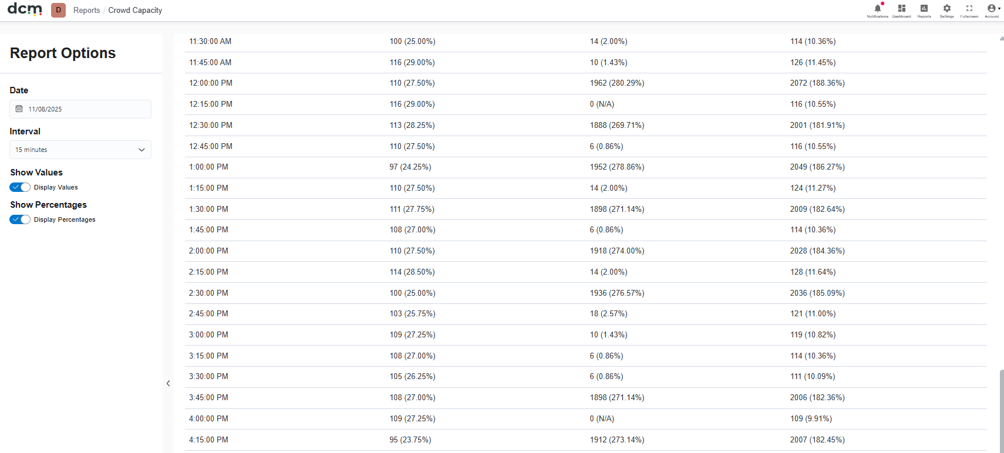
While there is currently no data export option for these reports, the interface does allow the data to be copied and pated directly into another tool such as MS Excel for further manipulation if desired..