
The standard DCM zone view shows a sample image from one or more cameras in the zone, and three graphs – the Density (which also includes the headcount in that view), as well as average Flow and average Mood.
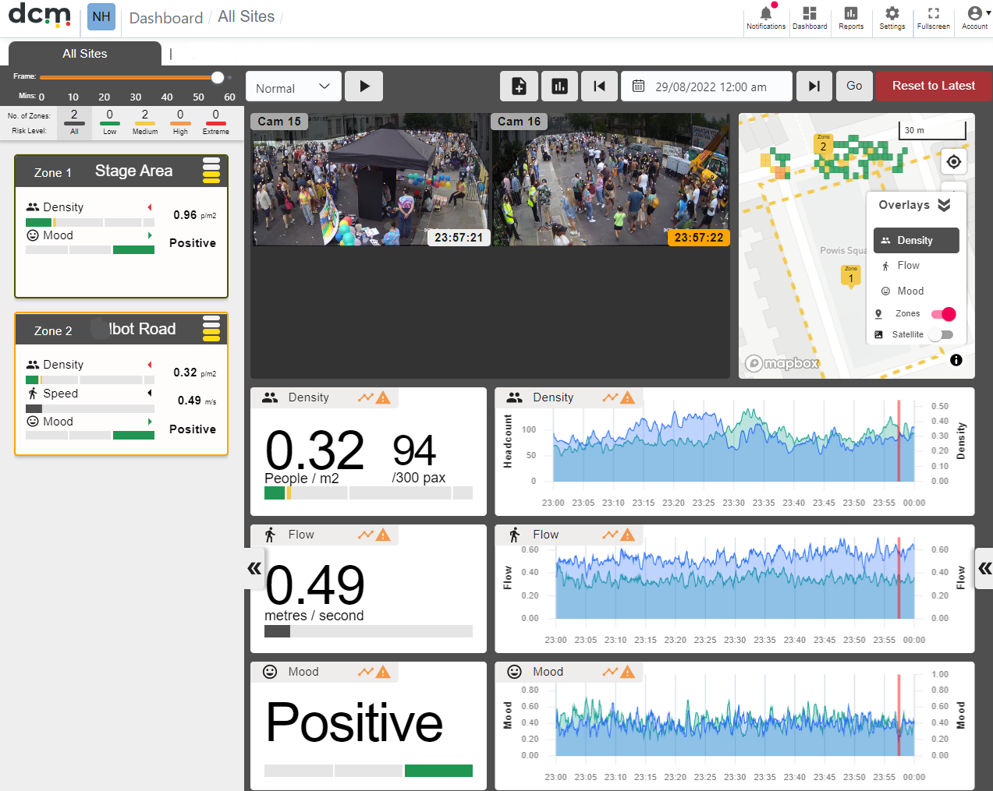
Above – the standard DCM dashboard WITHOUT cumulative counting active.
For a more detailed explanation of the standard DCM dashboard, see the main User Manual.
When the Cumulative Counting option is enabled in a zone, some additional information is displayed. These user interface features will be explained in the following pages.
Additional Dashboard elements
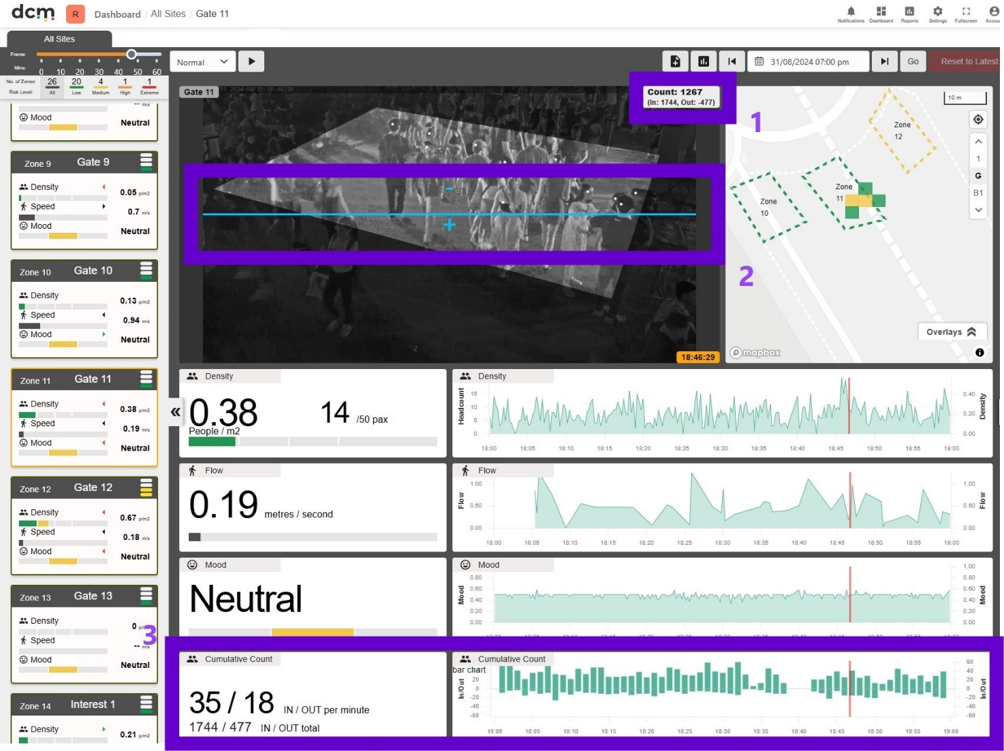
When Cumulative Counting is active, some new UI elements will be present, highlighted below in purple.
🎨 Additional UI Elements
|
Element |
Description |
|---|---|
|
Live Count of People |
Each camera view has a live count of people who have entered that gate in the top right corner. This is expressed as total persons ‘in’ minus total ‘out’ since midnight. |
|
Count Line |
The camera view now includes a count line, with “+” indicating the side designated as “IN” and a “-“ indicating “OUT”. The count line can be placed at any angle within the view. |
|
Fourth Graph |
A fourth graph is added, showing the current rate of entry and exit per minute as well as a visualisation of entry activity in that hour – which we will examine more closely on the next page. |
Key elements of the Cumulative Count graph.

-
Current ingress and egress rates are shown on the left side panel
-
The graph shows count data for one hour
-
The graph is divided by a horizontal 0 line. Each minute of count data is represented by a new vertical bar – with the half above the 0 line being the ‘IN’ count and the half below, the ‘OUT’ count for that minute.
-
Just as for the other graphs, you can view historical data by clicking the left mouse button on any part of the graph – here seen in the red line.
To return to the current time – use the red “Reset to Latest” button at the top right corner of the main dashboard page.
Cumulative Counting Reports
When the optional Cumulative Counting module is active in DCM, a new type of report is available, to give more detailed and configurable count information.
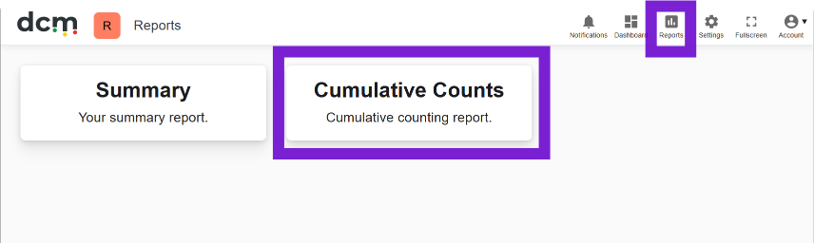
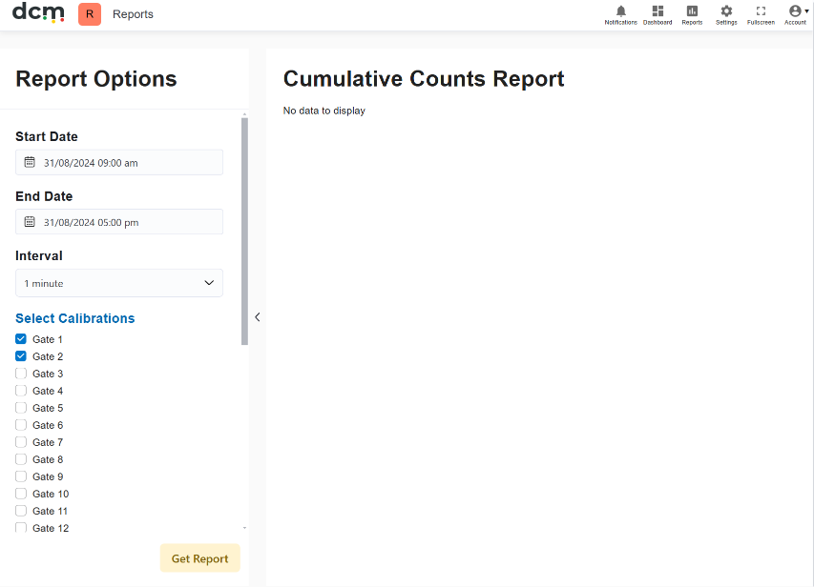
From the main Dashboard page, click the ‘reports’ icon near the top right, and in the menu that opens select the ‘Cumulative Counts’ report type.
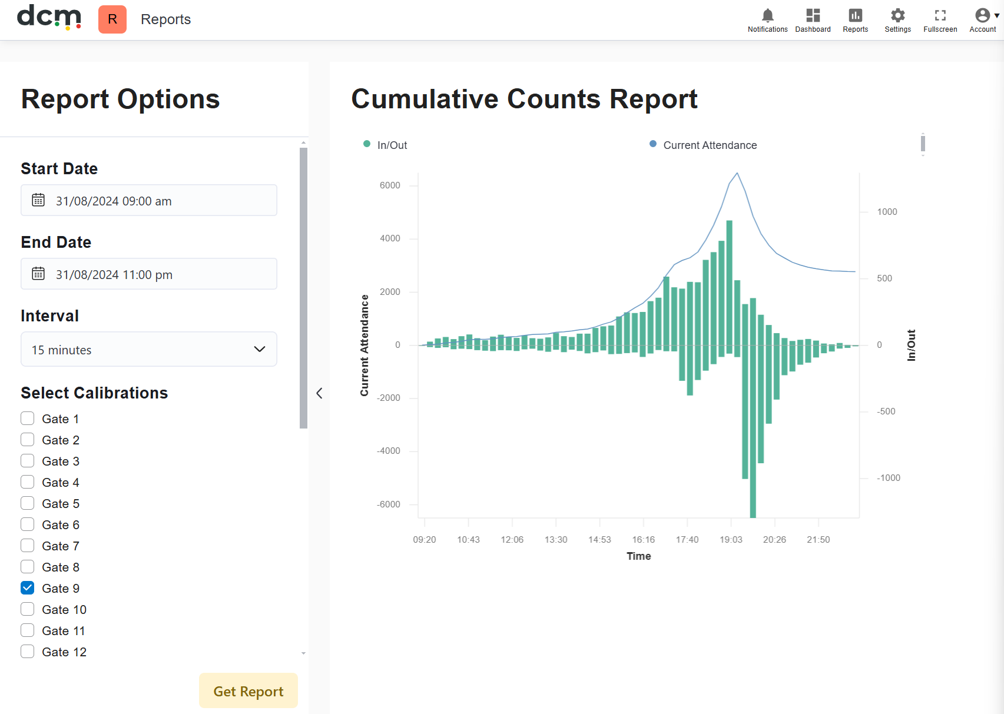
In the reports panel, you can use date picker tools to select a start and end date and time, a counting interval between 1 minute and 60 minutes, and the camera positions of interest. Once you are satisfied with your selections, press the ‘get report’ button at the bottom of the panel.
Similar to the Dashboard graph, these reports have a dividing horizontal 0 line. The reports will consist of a series of bars, representing count totals per period of time you selected. Anything above the 0 line represents movement ‘IN’ and anything below represents movement ‘OUT’.
The vertical scale to the right of the graph shows these numbers.
The graph also includes a total attendance line for the selected gate or gates. This is the accumulated total of people in or out. In the below example, the selected Gate had a peak ingress rate of about 1000 people in a 15 minute period. Overall for the day, around 6000 people entered using this gate, and around 3000 used it as an egress route.