

🗺️ Map View Dashboard (Density, Flow and Mood)
|
Feature |
Description |
|
|---|---|---|
|
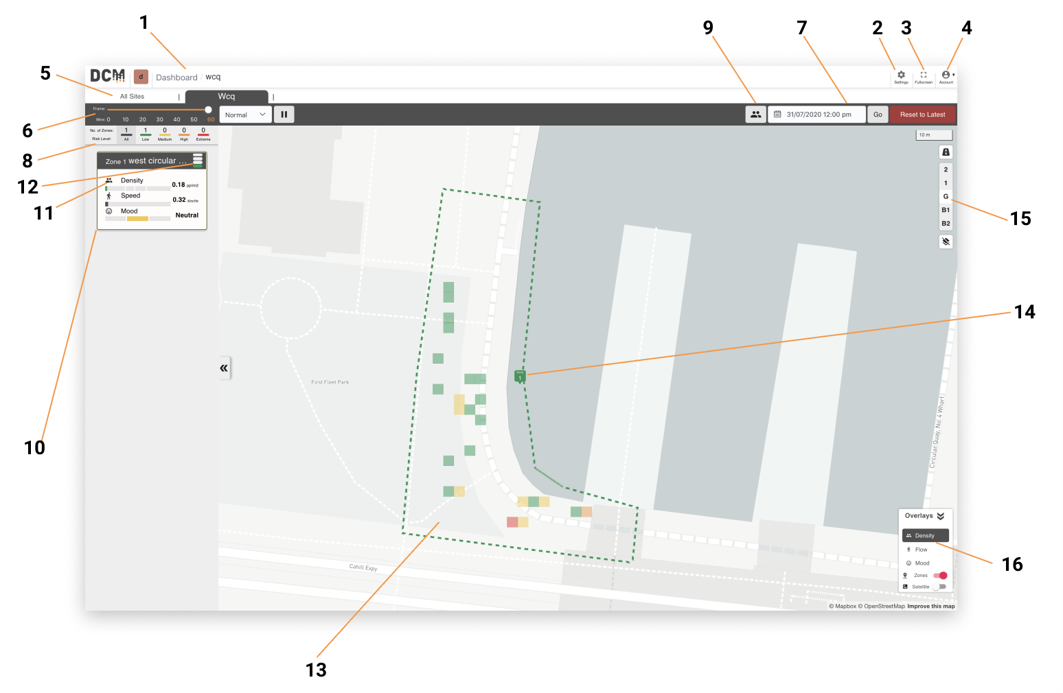
1 |
Project Navigation |
Navigation between projects and dashboard |
|
2 |
Settings |
Menu for editing the Calibration, deployment and the project detail. Admin user can also browse other projects, edit network setup, edit camera calibrations and edit member lists here |
|
3 |
Full screen view |
Toggle full screen view |
|
4 |
User Profile |
User can edit their details here or logout from the software |
|
5 |
Site Navigation |
Navigation between different sites and floor levels via the tabs and hyperlinks |
|
6 |
Frame and Time settings |
Control for time slider (per hour), playback speed, playback start and pause |
|
7 |
Time and Date navigation |
Navigation for time and date, to access historic data, go button for time and date picker. Latest footage button returns you to live feed. |
|
8 |
Risk totals |
Quick way to view the number of zones at each risk level, this is also a filtering tool to filter to that risk level |
|
9 |
DCM Core and Social Distancing toggle |
Button to change the measurements displayed from the DCM core features to Social Distancing mode. |
|
10 |
Zone card |
Card that provides brief statistics for one zone. |
|
11 |
Zone Key Metrics |
Status bar that reflects the three key metrics in a zone. These change if you are in Core or Social Distance mode. |
|
12 |
Zone Risk Level |
A visual indicator of risk level for that zone. |
|
13 |
Heat map |
The heat map of current risk level represented as a grid on the defined zone. |
|
14 |
Zone on map |
The area for the selected zone as defined during calibration. The colour of the zone border reflects the risk level. |
|
15 |
Level navigation |
Navigation between levels when defined. Each level is a separate site. |
|
16 |
Map overlays |
Toggles for the heat map feature, zone borders and the different map overlays. |
🎥 Video Footage page (Density, Flow and Mood)
|
Feature |
Description |
|
|---|---|---|
|
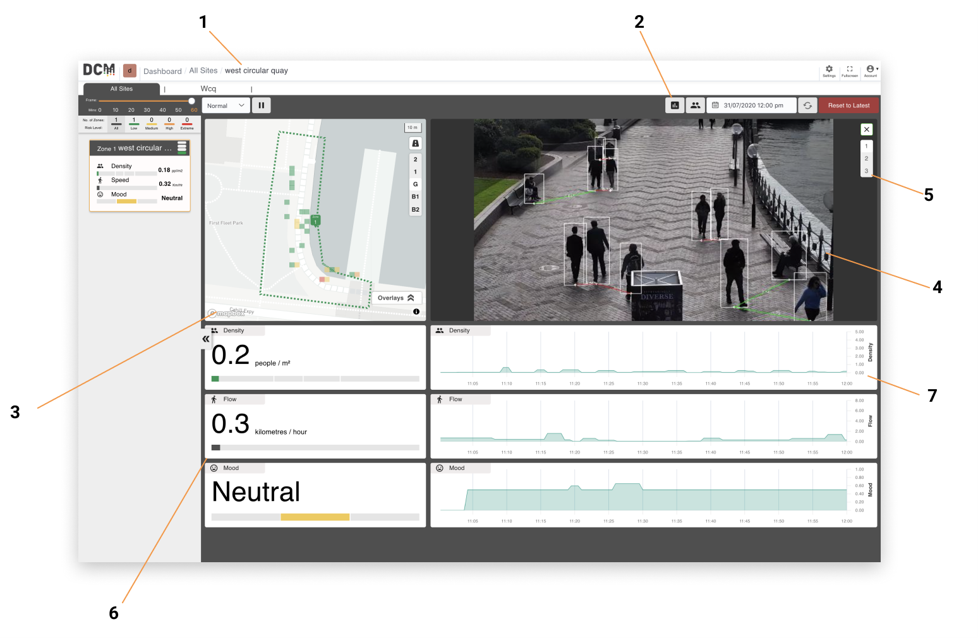
1 |
Breadcrumb |
Navigation tool; click the site name to go back to the overall map view. |
|
2 |
Configuration Tool |
Access the tool for defining risk levels and other display options. |
|
3 |
Map view |
A condensed view of the map area immediately surrounding the selected zone. |
|
4 |
Camera view |
Real time camera view, captured approximately every 15 seconds. If multiple scenes are defined for a single camera, the view may change according to which scene was most recently sampled. |
|
5 |
Scene toggle |
Toggles between the different scenes if configured as well as a button to stop the auto toggle between scenes. |
|
6 |
Key metrics |
Key metrics for the selected mode and zone. If there are multiple cameras in the zone, this is a total. If using multiple scenes, these figures represent the most recently sampled scene. |
|
7 |
Measurement graphs |
Line graphs of the measurements observed in the area in the last 60 mins |