Zone Configuration - Customized Risk Matrix
The main purpose of the configuration screen is to set meaningful risk thresholds for your particular circumstances. DCM will alert you when these thresholds are breached by highlighting the zone card and map area in orange or red.
The risk levels are separate to alarms. Risk levels are set at the zone level.
In order for the risk indicators to be meaningful, you should take into account the physical attributes of the space and crowd specific factors. For example, if using DCM for crowd safety, the acceptable crowd density for a concert will be significantly higher than the density acceptable at an indoor exhibition. Similarly, a restricted entryway will be expected to have a higher crowd density than a zone covering the interior of a venue. The configuration tool allows you to set alert thresholds accordingly, using a mix of factors that you control.
For example, for a critical access corridor where people are not allowed to congregate or expected to stop, it would make sense to have the risk level drive off flow alone. A room with a specific capacity may be set to drive risk indicators off density only. While a standing area in front of a concert stage, may drive the risk assessment based on a mixture of density and mood.
In general, risk levels are something that are set in consultation with interested parties and users of the software, using their experience and knowledge. They are usually set after consultation with Venue owners, Event organizers or Safety and Security representatives at the venue or event in question.
While the tool does have some rough default values, DCM allows the user to define what 'safe' or 'unsafe' levels are, by providing a flexible tool to set whatever mix of density, flow and mood threshholds are meaningful to the customer.
For example, for crowds at concerts, organizers are usually primarily interested in density, but may choose to mix in a weighting for mood at their discretion.
Even if using density alone, depending on the type of music, the type of crowd, weather conditions and venue infrastructure, some Event managers may consider a crowd density of more than 3 people per square meter to be a 'red/dangerous' level requiring action, while others may allow anything up to 5 people per square meter before getting concerned.
The process to set a risk level is described below.
|
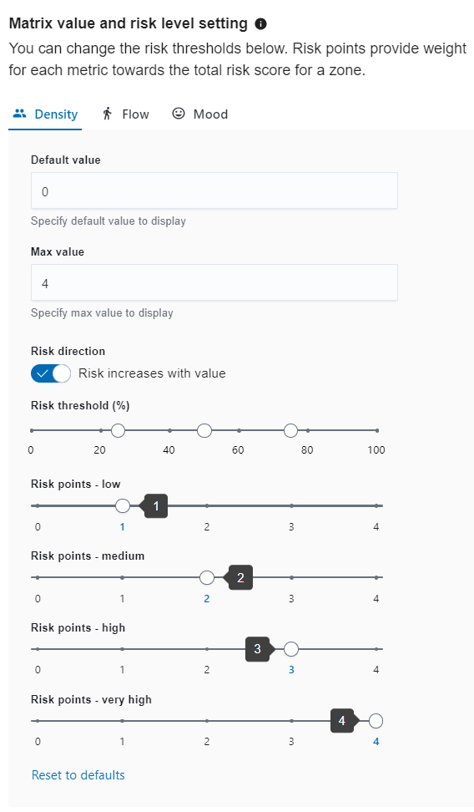
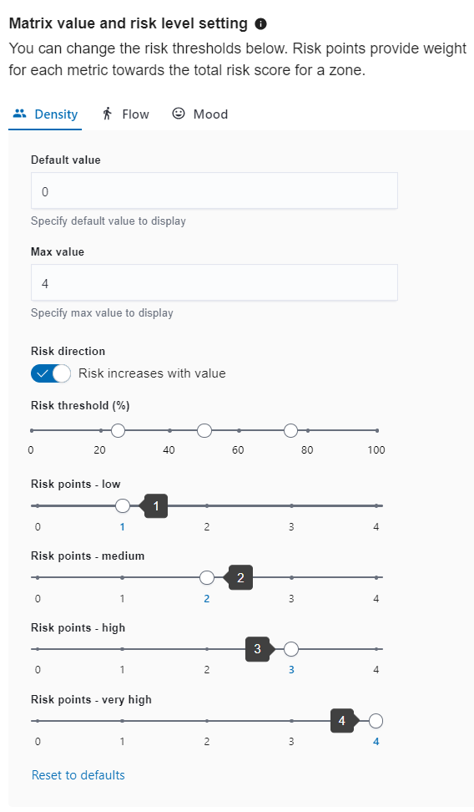
Matrix value and risk level setting:
|
|
|
Thresholds:
Risk Threshold represents the percentage from 0 to Max. Value where the risk transitions to the next level. In this example, 100% is 4 (or 4+) people per meter squared detected in the zone. Risk thresh-holds have been set at 25%, 50% and 75% of that using the scale at the top. So this sets up a relatively simple scale, where any density over 1 will move to yellow level risk, anything over 2 will move to amber and anything over 3 (75% of 4) people per square meter, will push the risk rating to the top red level..
Risk points:
|
|
|
|
||
|
. |