In general the API endpoints use standard metric units and scales, such as average number of people detected per square meter for density. Mood data however uses a custom scale.
The AI model gives each face a score between 0 and 1. With 1 being most negative, 0 being most positive and 0.5 being completely neutral. The dashboard uses the same scale in its graphs, but for useability and clarity translates these scores into an overall ‘Positive’, ‘Neutral’ or ‘Negative’ rating.
The API will return the raw AI model scores. All data for all endpoints is still aggregated for privacy reasons as DCM does not track individuals.
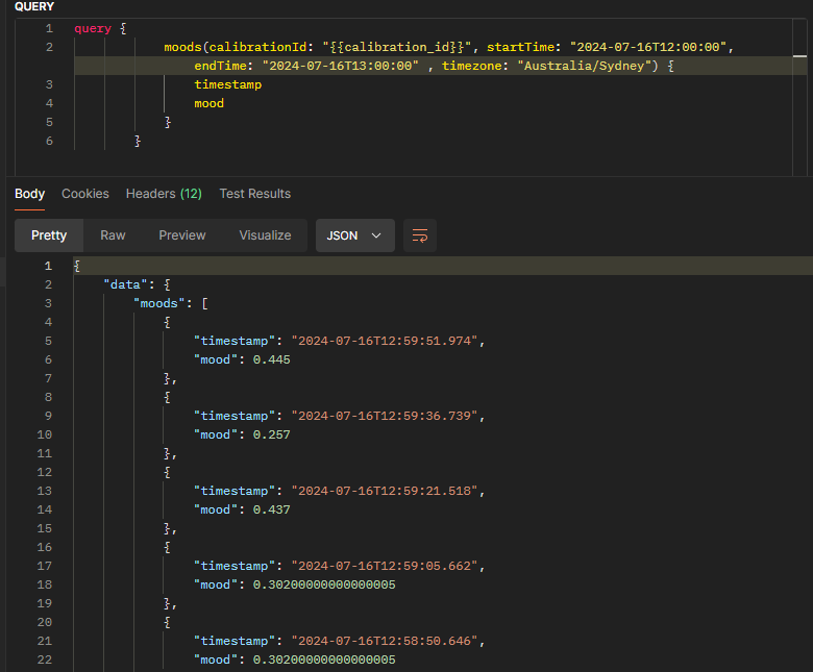
For each sample period it averages the score of all faces detected and posts a timestamp and average mood score.
Here is some example mood data taken with a fifteen second sample frequency.